Arithmetic Expressions - Pretty Plots

Arithmetic expressions are an essential part of almost any algorithm that solves a useful problem. Therefore, a basic skill in any computer programming language is to implement arithmetic expressions correctly. In this laboratory experience you will practice the implementation of arithmetic expressions in C++ by writing parametric equations to plot interesting curves.
Objectives:
- Implement arithmetic expressions in C++ to produce graphs.
- Use constants adequately.
- Define variables using adequate data types.
- Cast a data value to another type when necessary.
Pre-Lab:
Before you get to the laboratory you should have:
Reviewed the following concepts:
a. Implementing arithmetic expressions in C++
b. Basic data types in C++ (int, float, double)
c. Using "type casting" to cast the value of variables to other data types within expressions
d. Using arithmetic functions and constants from the
cmathlibrarye. The equation and graph of a circle.
Studied the concepts and instructions for the laboratory session
Taken the Pre-Lab quiz, available in Moodle.
Parametric Equations
Parametric equations allow us to represent a quantity as a function of one or more independent variables called parameters. In many occasions it is useful to represent curves using a set of parametric equations that express the coordinates of the points of the curve as functions of the parameters. For example, in your trigonometry course you should have studied that the equation of the circle of radius , and centered at the origin has the following form:
The points that satisfy this equation are the points that form the circle of radius and center at the origin. For example, the circle with and center at the origin has the equation
and its points are the ordered pairs that satisfy this equation. A parametric representation of the coordinates of the points in the circle of radius and center at the origin is:
where is a parameter that corresponds to the measure (in radians) of the positive angle with initial side that coincides with the positive part of the -axis and the terminal side that contains the point , as illustrated in Figure 1.
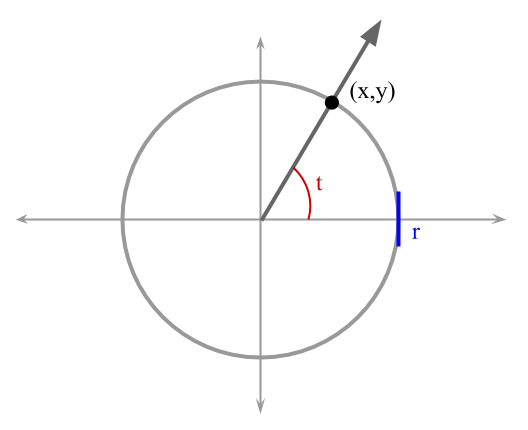
Figure 1. Circle of radius and centered at the origin.
To plot a curve that is described by parametric equations, we compute the and values for a set of values of the parameter. For example, Figure 2 shows the , and values for some of the points in the circle with .
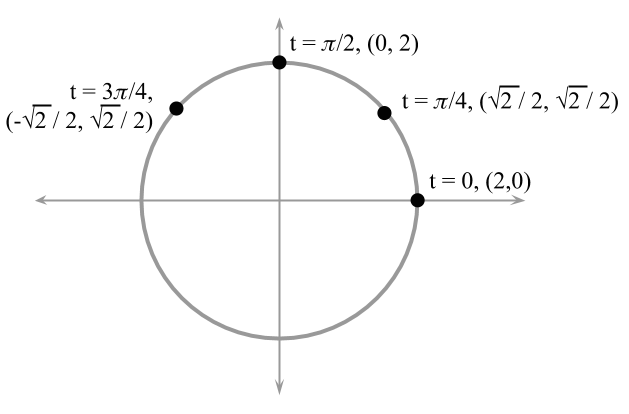
Figure 2. Some of the coordinates of the points of the circle of radius and centered at the origin.
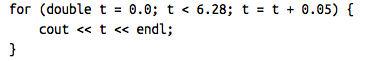
for (double t = 0.0; t < 6.28; t = t + 0.05)
is repeated as long as the value of is less than . After each iteration the value of is incremented by . Thus, the first four values will be 0, 0.05, 0.10 and 0.15.
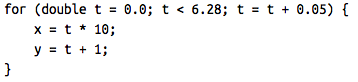
for (double t = 0.0; t < 6.28; t = t + 0.05)
is repeated as long as the value of is less than . After each iteration the value of is incremented by . Thus, the first four values of t be 0, 0.05, 0.10 and 0.15. The values of will be . The values of will be .
( 11 ∗ 4 + 1 ∗ 2 ) / 12. Notice that the expression consists of only integers.
3 because 46 / 12 is computed as an integer division, which results in an integer quotient.
static_cast<double> ( ( 10 ∗ 4 + 1 ∗ 2 ) / 11) ?
3.0 because the static_cast<double> affects the result of an expression that only consists of integers. Thus, the expression is equivalent to static_cast<double>(42 / 11).
Laboratory Session:
Exercise 1 - Plotting Interesting Curves
Instructions
Load the project
prettyPlotintoQtCreator. There are two ways to do this:- Using the virtual machine: Double click the file
prettyPlot.prolocated in the folder/home/eip/labs/expressions-prettyplotsof your virtual machine. - Downloading the project�s folder from
Bitbucket: Use a terminal and write the commandgit clone http://bitbucket.org/eip-uprrp/expressions-prettyplotsto download the folderexpressions-prettyplotsfromBitbucket. Double click the fileprettyPlot.prolocated in the folder that you downloaded to your computer.
- Using the virtual machine: Double click the file
Configure the project and run the program by clicking the green arrow in the menu on the left side of the Qt Creator window. The program should display a window similar to the one in Figure 3.
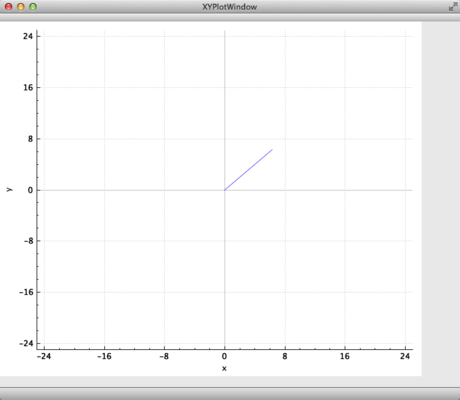
Figure 3. Line segment displayed by the program PrettyPlot.
The file
main.cpp(in Sources) contains the functionmain()where you will be adding code. Open this file and study the code.QApplication a(argc, argv); XYPlotWindow wLine; XYPlotWindow wCircle; XYPlotWindow wHeart; XYPlotWindow wButterfly; double y = 0.00; double x = 0.00; double increment = 0.01; for (double t = 0; t < 2*M_PI; t = t + increment) { // parametric equations x = t; y = t; // add x and y as a point in the graph wLine.AddPointToGraph(x,y); } // After all the points have been added, plot and show the graph wLine.Plot(); wLine.show();The line
XYPlotWindow wLine;creates the objectwLine, which is the window that will show the plot of a graph, in this case the graph of a segment. Look at theforloop. In this cycle several values for are generated and a value for and is computed for each . Each ordered pair is added to the graph of the segment by the methodAddPointToGraph(x,y). After the cycle, there is a call to the methodPlot(), to "draw" the points on the graph, and to the methodshow(), to show the plot. The methods are functions that allow us to work with the data of an object. Note that each of the methods is written afterwLine, and followed by a period. In a future laboratory experience you will learn more about objects and you will practice how to create them and invoke their methods.The expressions for and are parametric equations for the line that passes through the origin and has the same value for and . Explain why this line only goes from 0 to approximately 6.
You will now write the code needed to plot a circle. The line
XYPlotWindow wCircle;creates the objectwCirclefor the window that will contain the plot of the circle. Using the code that plotted the segment as inspiration, write the necessary code for your program to graph a circle of radius 3 centered at the origin. Run your program and, if it is necessary, modify the code until you get the right plot. Remember that the circle should be plotted inside thewCircleobject. Thus, when you invoke theAddPointToGraph(x,y),Plotandshowmethods, they should be preceeded bywCircle; for example,wCircle.show().Your next task is to plot a curve with the following parametric equations:
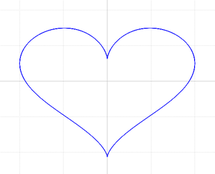
If you implement the equations correctly, you will see the image of a heart. This plot should be obtained inside an
XYPlotWindowobject calledwHeart.You will now plot the curve of the following parametric equations:
Note that both expressions are almost the same, the only difference is that one starts with and the other with . Instead of computing twice, you can assign its value to another variable and compute and as follows:
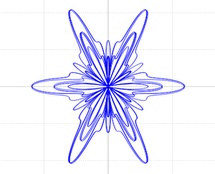
Implement the above expressions, change the condition for termination of the
forloop tot < 16*M_PI, and look at the plot that is displayed. It should look like a butterfly. This plot should be obtained inside anXYPlotWindowobject calledwButterfly.
In [2] and [3] you can find other parametric equations of interesting curves.
Exercise 2 - Computing the Grade Point Average (GPA)
In this exercise you will write a program to obtain a student's grade point average (GPA). Suppose that all courses in Yauco's University are credits each and have the following point values: points per credit; points per credit; points per credit; point per credit and points per credit.
Instructions
Start a new "Non-Qt" project called Average. Your
main()function will contain the necessary code to ask the user for the number of A's, B's, C's, D's and F's obtained and compute the grade point average (GPA).Your code should define the constants for the points per credit, and ask the user to input the values for the variables , , , , . The variable represents the number of courses in which the student obtained , represents the number of courses in which the student obtained , etc. The program should display the GPA using the 0-4 point scale.
Hints:
a. You can obtain the GPA by adding the credit points corresponding to the grades (for example, an A in a 3 credit course has a value of 12 points), and dividing this sum by the total number of credits.
b. Remember that, in C++, when both operands in the division are integers, the result will also be an integer; the remainder will be discarded. Use "type casting":
static_cast<type>(expression)to solve this problem.Verify your program by computing the GPA of a student that has two A's and 2 B's; what is the average of this student? When your program is correct, save the
main.cppfile.
Deliverables
Use "Deliverable 1" in Moodle to submit the file
main.cppcontaining the code with the parametric equations for the graphs of the circle, the heart, and the butterfly. Remember to use good programming practices, include the names of the programmers and document your program.Use "Deliverable 2" in Moodle to submit the file
main.cppwith the code to compute grade average. Remember to follow the instructions regarding the names and types of the variables, include the names of the programmers, document your program and use good programming practices.
References:
[1] http://mathworld.wolfram.com/ParametricEquations.html